How can a marketplace support its growth while improving deliveries and customer experience?
A study of 26 hypotheses across nine Olist tables, from January 2017 to August 2018, turned into measurable recommendations. This is a portfolio case: Olist did not commission it.
The business question
How can sales growth be supported while improving delivery reliability and customer experience? The study covers 26 hypotheses on sales, products, sellers, payments, geography, satisfaction and repeat purchases.
Checking the sources before analysing
The nine tables are joined at the right level of detail: items, payments and reviews are aggregated before being linked to orders. Keys, references, timelines and amounts are checked. Payments match items plus shipping for 99.7% of delivered orders, and anomalies are kept visible rather than corrected arbitrarily.
Growth driven by volume
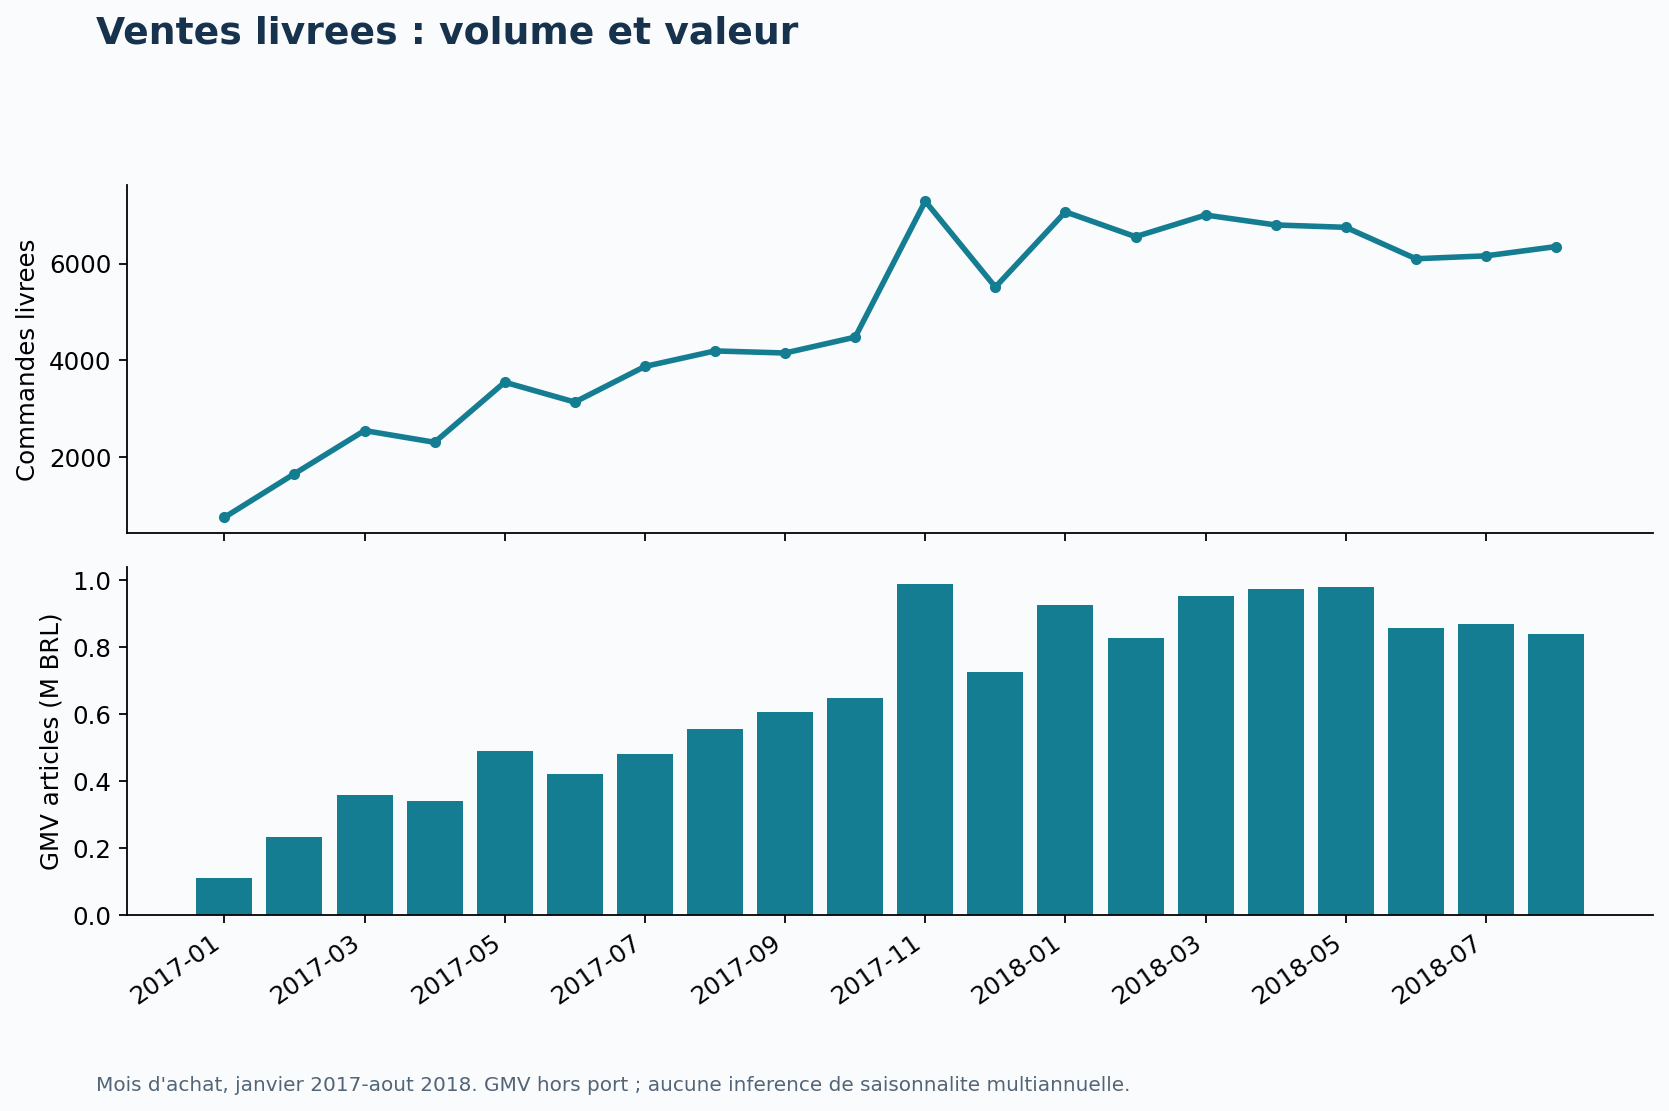
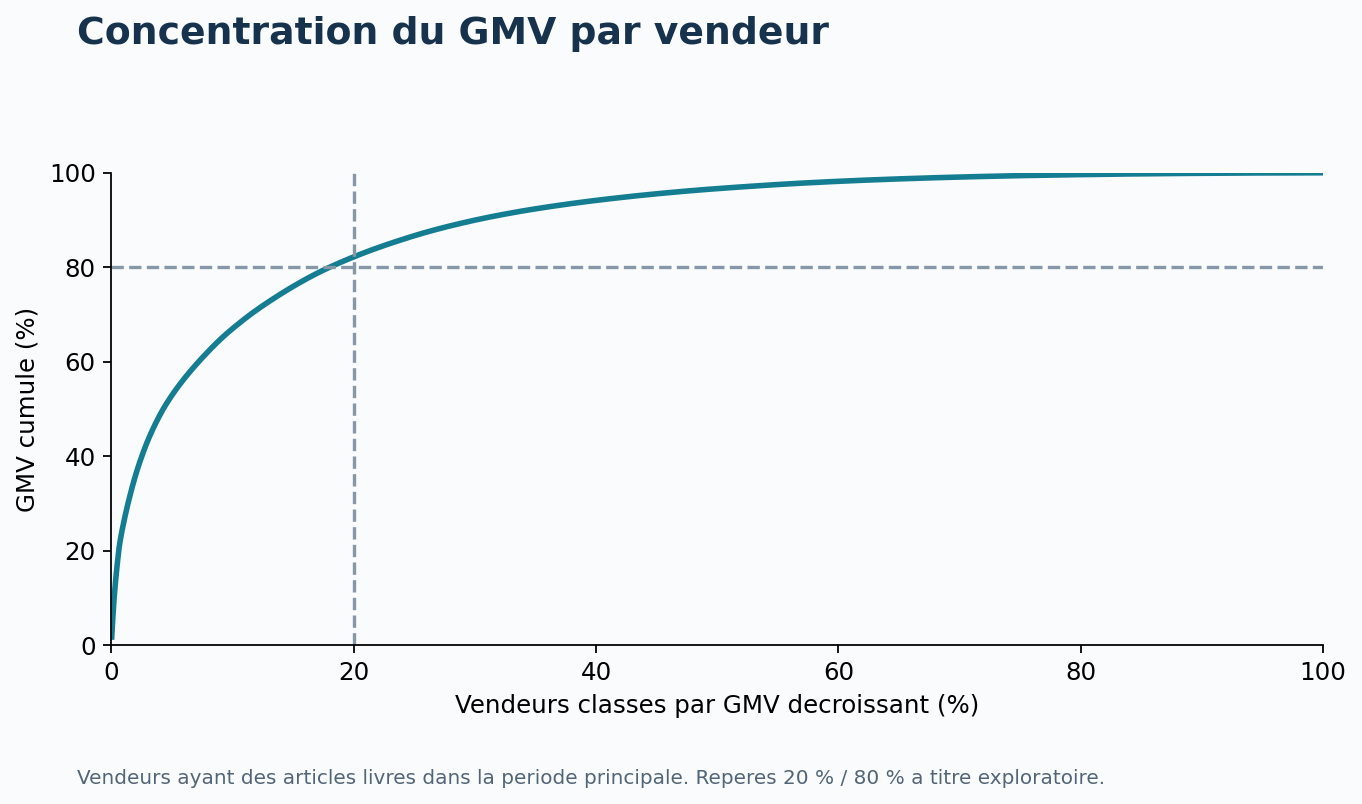
From January to August, delivered orders rise from 21,998 in 2017 to 52,783 in 2018 (+139.9%), while the average basket stays flat (+0.5%). Activity is concentrated: 20% of sellers generate 82.2% of GMV, which justifies closer monitoring of key sellers.
Delays and satisfaction: a result that depends on which reviews you keep
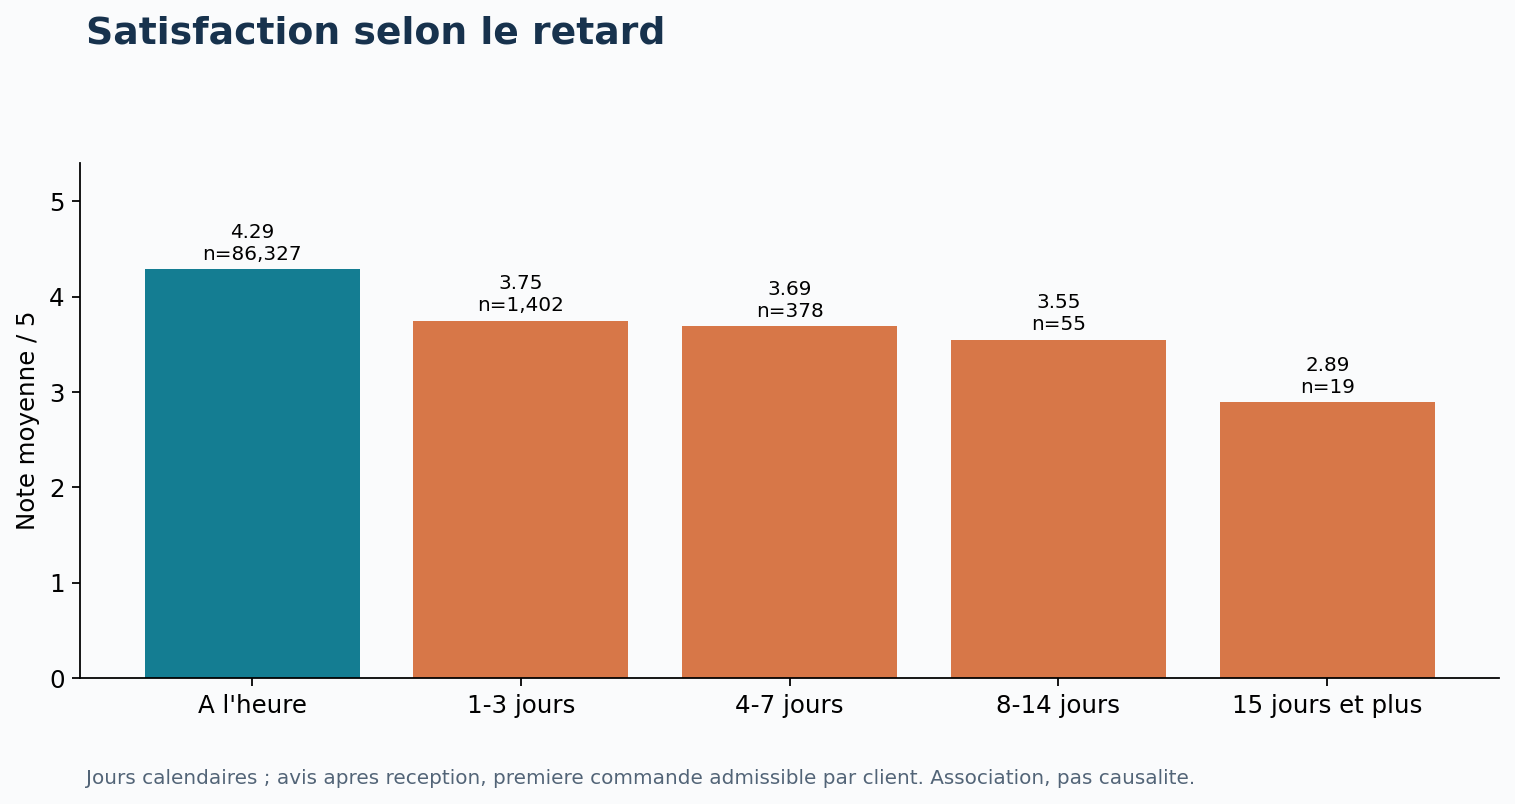
6.8% of delivered orders arrive late. Among reviews written after delivery, a delay is associated with a rating 0.57 points lower (95% CI: −0.63 to −0.51). But only 29.9% of reviews of late orders are written after delivery: including the others or not changes the reading considerably. These gaps are associations, not causal effects.
Recommendations to test, not announced gains
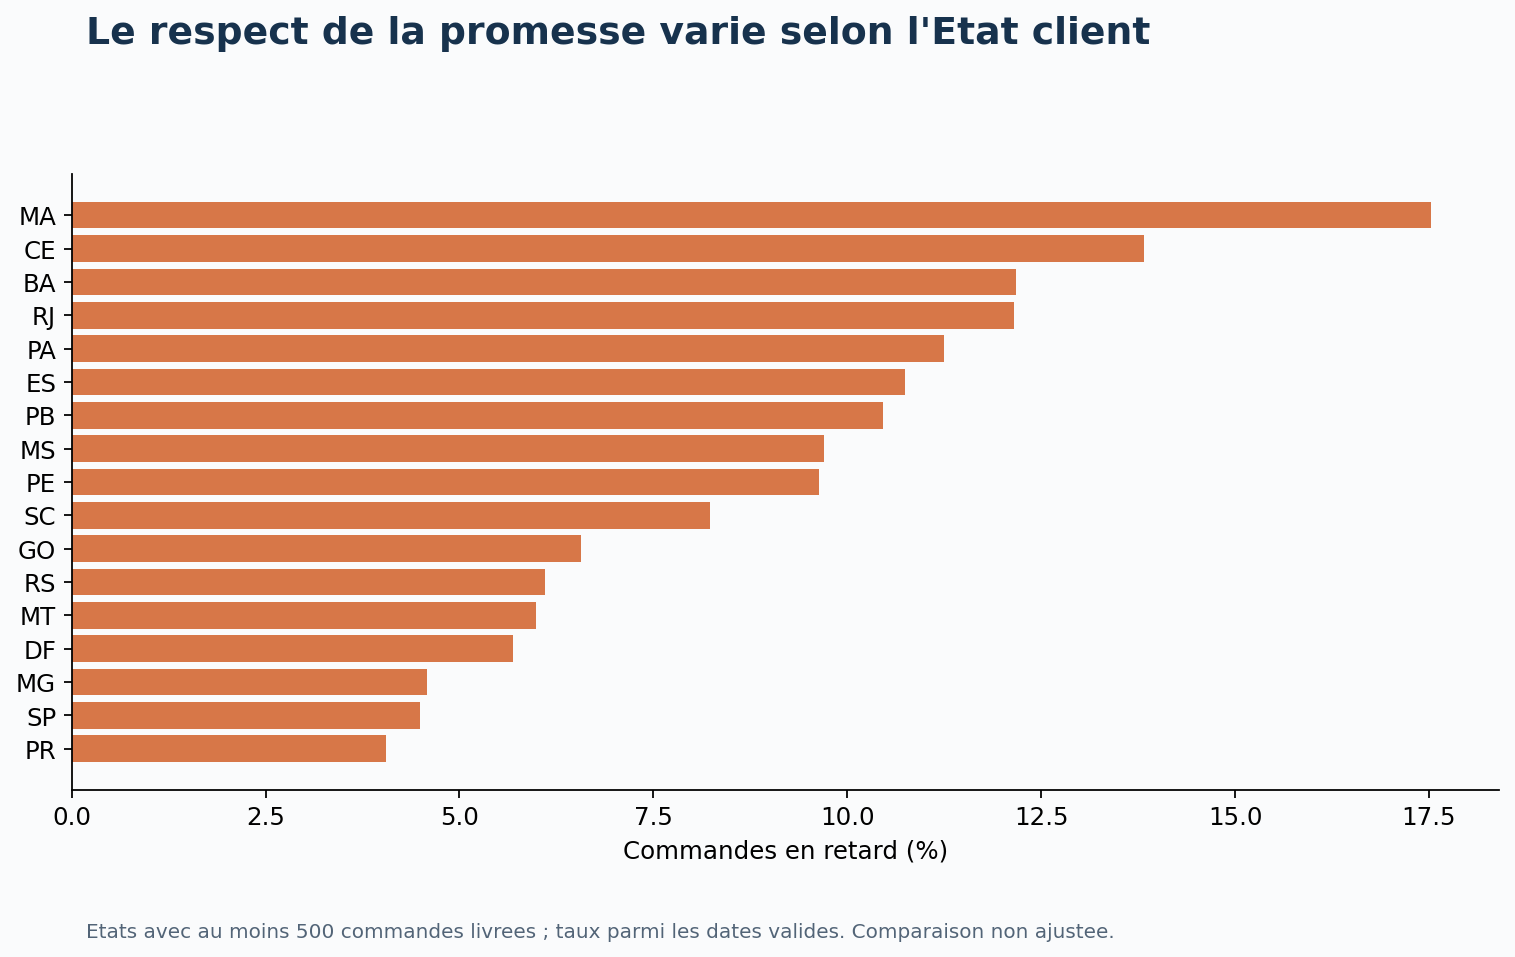
The action plan sets out five priorities, each with a metric and a validation protocol: audit multi-seller orders (ratings 1.46 points lower), adapt the delivery promise to geographic flows (15.2 days between states versus 7.9 within a state), secure key sellers and test a post-delivery follow-up with a control group. The Power BI project (4 pages, 27 measures) still needs to be validated in Power BI Desktop.
Source: Brazilian E-Commerce Public Dataset by Olist (Kaggle). Charts from the project repository.
- 96,211 delivered orders analysed, 26 hypotheses tested with multiple-testing correction
- +139.9% growth driven by volume; 20% of sellers generate 82.2% of GMV
- 6.8% late deliveries; ratings 0.57 points lower after delivery
- Five-priority action plan, each with its metric and validation
Do you sell online?
This data exists in the back office of every online store. The same work, applied to your orders, is the basis of a reliable dashboard.